Objective
A lot of organizations lack the people and the tooling to run effective incident response. The hardest part is not collecting data, it is knowing what is normal and what might be malicious. That is the question that keeps you up at night.
The usual advice is to establish a baseline. That is easier said than done in most environments, and even once you have one, you still need a way to use it. Software is expensive, it takes time to configure, and analysts need training before any of it pays off.
This lab builds a repeatable, scalable triage method for teams with none of that: no dedicated IR staff, no EDR, no budget. It uses tools that are either free or already sitting in your environment. It uses PowerShell and Python, but running it requires no coding.
The core idea is differential analysis. If you know what normal looks like, you can compare those indicators against the ones on a host you suspect is compromised, and review only what is present on the target but absent from the baseline.
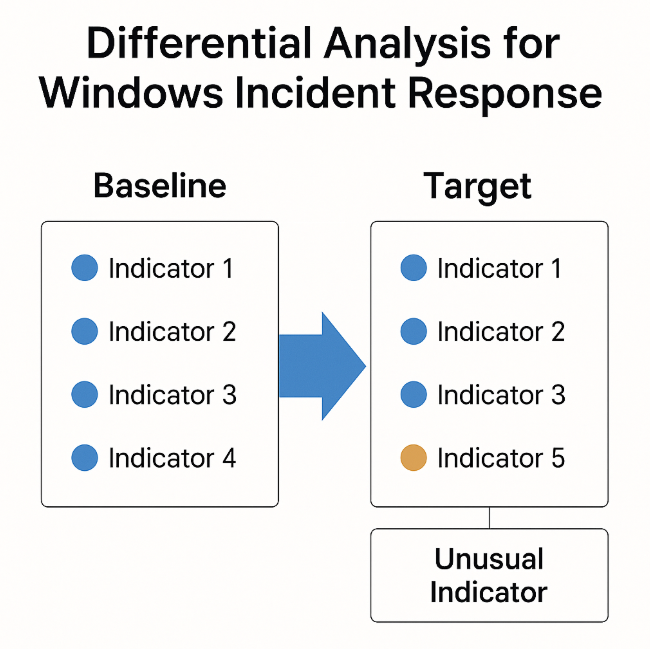
That single filter is what makes the workload tractable. Instead of sifting through every service, task, and connection on a machine, you look at the residue.
Setup
The toolkit is three files:
01_Artifact_Collector.ps1, run on the target machineCSV_Merge.py, run on the analysis machineCF_config.json, which drives the Excel conditional formatting
You need Python 3.10 or newer with pandas, openpyxl, and xlsxwriter installed. Optionally, any
third-party tools you already use, such as SQLite3 or the Eric Zimmerman forensic suite, can be folded
into the collector.
Nothing is hard-coded. The Python script reads four environment variables, so the paths are yours to choose:
WinIR_Baseline_Backup=C:\WinIR\Baseline
WinIR_Case_Data=C:\WinIR\Case_Data\Target
WinIR_Case_folder=C:\WinIR\Cases
WinIR_Config_Folder=C:\WinIR\Configs
Collecting a baseline
Decide which artifacts you want before you collect anything. I would recommend a separate baseline for each asset type you run, such as finance, shop floor, or engineering. The closer the baseline is to the target’s role, the less noise survives the filter.
To capture one, run the collector on a known-good machine of that type and move the results into the
folder you set for WinIR_Baseline_Backup.
The collector itself is intentionally bare-bones. Other tools exist for this, such as KAPE and Velociraptor, each with their own strengths. I kept this one minimal to push you to think about your own approach: how you move files, what artifacts you generate, and, most importantly, what you can reasonably interpret once you have them.
Out of the box it captures services, scheduled tasks, DNS cache, the process list, autoruns, and a one-minute sample of TCP connections:
Write-Host "Services Collection In Progress"
Get-WmiObject win32_service |
  Select-Object name,state,displayname,processid,startmode,pathname,startname |
  Export-Csv C:\temp\_temp\services.csv -NoTypeInformation

Write-Host "Process list Collection In Progress"
Get-WmiObject win32_process |
  Select-Object name,executablepath,processid,parentprocessid,commandline |
  Export-Csv C:\temp\_temp\plist.csv -NoTypeInformation
Network connections are sampled on a timer rather than captured once, because a single snapshot misses anything short-lived:
$timespan = New-TimeSpan -Minutes 1
$timer = [diagnostics.stopwatch]::startnew()
while ($timer.elapsed -lt $timespan) {
    Get-NetTCPConnection | Where-Object state -ne "Bound" |
      Select-Object localaddress,localport,remoteaddress,remoteport,state,owningprocess,
        @{Name="process";Expression={(Get-Process -id $_.OwningProcess).ProcessName}} |
      Export-Csv C:\Temp\_temp\net_connect.csv -NoTypeInformation -Append
    Start-Sleep -Seconds 3
}
Everything lands in a Target folder stamped with the hostname and collection time, which becomes the
unit you move to the analysis machine.
Managing the conditional formatting rules
The last piece of setup is CF_config.json. You will not touch it often, only when you add a new
artifact and want it included in the highlighting.
Each entry is one sheet:
{
  "Sheet_name": "target_services",
  "Cell_Range": "F2:F1000",
  "Formula": "AND(COUNTIF(baseline_services!$F:$F, F1) = 0, F1<>\"\")"
}
To add an artifact, copy an existing block, keeping the comma between entries. Update Sheet_name to
match your new file, and keep the target_ prefix or no formatting will be applied. Then pick the
column you want evaluated and change every column letter in the formula to match.
The formula is the whole method in one line: highlight the cell when its value does not appear anywhere in the baseline’s matching column, and the cell is not blank.
Implementation
CSV_Merge.py runs in four stages. It opens a numbered case folder, arranges the baseline and target
files, merges every CSV into one workbook, and applies the highlighting.
Case numbering is automatic, so each run is self-contained and comparable later:
def get_next_case_number(case_root_path):
    case_numbers = [int(num) for num in os.listdir(case_root_path)]
    return max(case_numbers) + 1
Baseline and target files share the same filenames, so each set is prefixed before the merge. That prefix is what the Excel formulas key on later:
rename_files_with_prefix(paths["baseline"], "baseline")
rename_files_with_prefix(paths["target"], "target")
Every CSV then becomes a worksheet in a single workbook. Control characters are stripped on the way in, because a stray byte in a command line or path will otherwise break the Excel writer:
ILLEGAL_CHARACTERS_RE = re.compile(r'[\000-\010]|[\013-\014]|[\016-\037]')

def merge_csvs_to_excel(output_folder):
    csv_data_dict = []
    for file in os.listdir(output_folder):
        if not file.endswith(".csv"):
            continue
        df = pd.read_csv(os.path.join(output_folder, file))
        csv_data_dict.append({"Sheet_Name": file.split(".")[0], "Data_Frame": df})

    with pd.ExcelWriter(os.path.join(output_folder, "unified_book.xlsx"),
                        engine="xlsxwriter") as writer:
        for entry in csv_data_dict:
            df_clean = entry["Data_Frame"].map(
                lambda x: ILLEGAL_CHARACTERS_RE.sub('---', x) if isinstance(x, str) else x
            )
            df_clean.to_excel(writer, sheet_name=entry["Sheet_Name"], index=False)
Finally the rules from CF_config.json are applied to the target sheets and the workbook opens:
yellowfill = PatternFill(start_color='FFFF00', end_color='FFFF00', fill_type='solid')

for entry in config_data:
    try:
        sheet = xl_workbook[entry["Sheet_name"]]
        sheet.conditional_formatting.add(
            entry["Cell_Range"], FormulaRule(formula=[entry["Formula"]], fill=yellowfill)
        )
    except Exception as e:
        print(f"Formatting failed for sheet {entry['Sheet_name']}: {e}")
Wrapping each rule in its own try matters more than it looks. A config entry pointing at a sheet
that was not collected this run should skip that one rule, not abandon the whole workbook.
Walkthrough
Move the collector to the host you want to investigate and run it. It reports each stage as it goes.
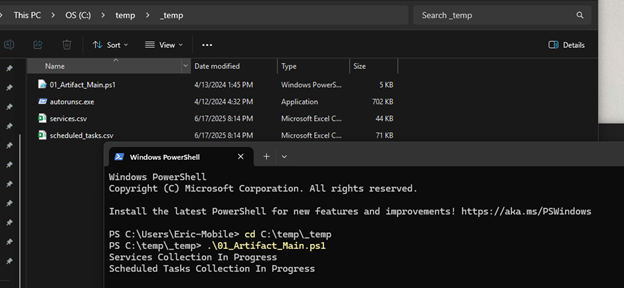
When it finishes, the generated Target folder can be moved wholesale to the analysis machine. Clean
up afterwards: revert any config changes and delete the tools from the target host.
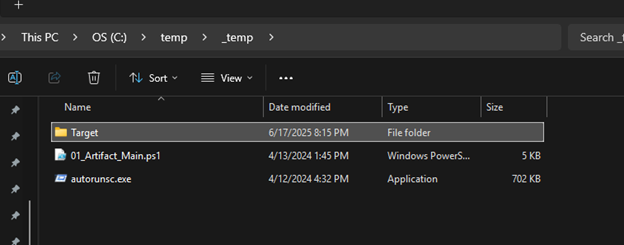
With the target data in place, run the Python script. In a second or so it prints the CSVs it processed and Excel opens with the marked-up workbook.
Using the workbook is deliberately simple. On each target worksheet, select all columns and enable the filter from the Data ribbon. Then open the filter dropdown, choose “Filter by Color”, and pick the highlight color.
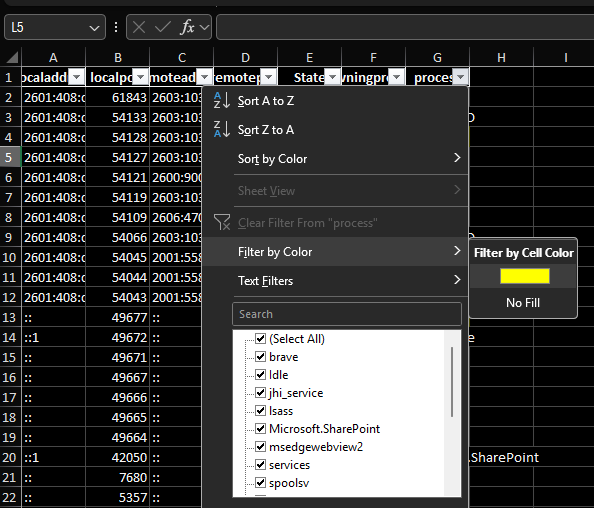
What is left is the set of artifacts that exist on the target and have no match in the baseline.
Findings
Filtering by color typically leaves under 10 percent of the original rows to review per host, though the exact reduction depends on how variable the field you filter on actually is. Process lists and services collapse hard. Network connections vary more, which is why they are sampled rather than snapshotted.
A few things that came out of building it:
- The baseline’s specificity drives everything. A generic golden image produces far more noise than a baseline taken from the same asset class as the target.
- Choosing the right column matters as much as the artifact. Diffing on a service’s binary path is useful. Diffing on a PID is worthless, because it changes every boot.
- Keeping the collector minimal was the right call. It forces you to decide what you can actually interpret, rather than collecting everything and drowning in it.
- Excel is the right output. Not because it is elegant, but because every analyst already knows how to filter a spreadsheet, and that removes the training barrier entirely.
The reduction is the point. It does not tell you what is malicious, it tells you where to look, which is the expensive part of triage when you have no tooling to do it for you.
Next Steps
- Extend the collector with artifacts you can interpret, such as prefetch, shimcache, or registry run
keys, adding a matching
CF_config.jsonblock for each. - Replace the manual color filter with a generated summary sheet listing every unmatched row across all artifacts.
- Track how often a highlighted artifact turns out to be benign, and use that to prune fields that produce noise rather than signal.